Tuesday, October 16, 2012

Unemployment in the UK 2012

UK Unemployment since 1979.

See updated post on UK Unemployment

Brief History of Unemployment in UK

UK unemployment-1881-2015 UK unemployment 1881-2015. Source: ONS historical unemployment + ONS

After the ravages of the Great Depression era where unemployment was over 22%, unemployment in the UK remained relatively low from 1945 until the late 1970s. When Beveridge introduced the Welfare State in 1945, one thing he mentioned was the necessity of maintaining full employment. Using demand management policies and benefiting from a boom in global trade, the UK more or less achieved full employment, until the 1970s. In the 1970s, rising oil prices caused stagflation and unemployment began to rise but was still relatively low.

It was in the manufacturing recession of 1980-81 when unemployment rose to unprecedented levels. Not only did unemployment reach 3 million, but, it remained stubbornly high until 1986 well into the economic recovery. The huge rise in unemployment was due to the strong value of the Pound, high interest rates and the deflationary impact of strict monetarist policies. In particular, it was the manufacturing sector that suffered. Male full time, unskilled labour was particularly affected.

Unemployment remained high throughout the 1980s. Even at the peak of the boom in 1989, 1.6 million people were unemployed. This figure involved high rates of structural unemployment (also known as the natural rate of unemployment). This structural unemployment was because the recession of 1981 had made many unskilled workers unemployed. In the fast changing workplace, these former coal miners and ship builders struggled to get work in the new economy. Geographical unemployment was also a strong feature of the 1980s. Former areas of manufacturing and mining, struggled to cope with the large scale redundancies.

In 1991, unemployment rose again, as the economy slipped into another recession. Unemployment peaked in 1993 at just under 3 million. Unlike the 1980s, unemployment fell quicker. From the mid 1990s to 2008, UK unemployment was relatively low. Looking at official statistics, unemployment was fairly close to full employment at just over 3%.

Low unemployment was due to:

  • Long period of economic growth
  • Disguised unemployment, many unemployed were allowed to take sickness and disability benefits. Therefore, they are not counted as unemployed. See also: What is True Level of Unemployment?
  • The Labour Force survey has consistently been higher than the government record of people on Job seekers allowance. This reflects the fact it is very difficult to get benefits these days. Some unemployed are not eligible for benefits for a variety of reasons.
  • Regional Recovery. Former depressed areas like South Wales and the North East have been relatively successful in finding new industries to replace the old heavy manufacturing.
  • New Deal. Better education and training for the unemployed to get back to work.


This shows that unemployment is highly cyclical. When the economy goes into recession, unemployment typically has increased to 3 million. 

Unemployment during great recession.

Unemployment rose in the great depression, but was still lower than in previous recessions. For more on unemployment in this period see: the UK unemployment mystery.

    Other essays:

    Wednesday, October 3, 2012

    Factors that determine international competitiveness

    A look at factors affecting international competitiveness. International competitiveness is a measure of the relative cost of goods/services from a country. Countries which can produce the same quality of goods at a lower cost are said to be more competitive.

    1. Relative Inflation

    If the inflation rate is relatively lower than in other countries, then over time you become more competitive because your goods will be increasing at a slower rate. For example, in the post-war period, Japan and Germany had relatively lower inflation rates than major competitors, this helped them to become more competitive.


    This graph of relative inflation rates showed that during the period shown, inflation in Greece fell from close to 5% to below 2%. This suggests that Greece will have become slightly more competitive in this period.

    2. Productivity

    Productivity is a measure of output per input. The most common measure would be labour productivity. For example, with improved technology and education, a country can enjoy higher labour productivity and therefore produce goods at a lower cost. Higher labour productivity is the key to increasing competitiveness and living standards at the same time.

     
    German vs Italian labour productivity. During this period, Italian labour productivity growth has tended to lag behind Germany, leading to lower competitiveness of Italian exports.


    This shows labour productivity index for the UK and Germany. Between 1990 and 2005, Germany labour productivity increased 25 base points. UK labour productivity increased by 35 base points. Showing that the UK had faster improvements in labour productivity during this period.

    3. Exchange Rate

    Movements in the exchange rate will determine competitiveness. For example, a sharp depreciation will make exports cheaper and more competitive. An increase (appreciation) in the exchange rate, makes the foreign currency price more expensive.

    Often movements in the exchange rate reflect relative costs. For example, if a country has lower inflation, this will lead to an appreciation in the exchange rate, making exports relatively more expensive. Thus a floating exchange rate helps to maintain relative competitiveness levels.

    However, sometimes economies can artificially maintain a lower value of the exchange rate to maintain competitiveness. For example, China has been accused of exchange rate manipulation. China buys large quantities of US securities, this causes an increase in the value of the dollar and helps to keep the Yuan undervalued. Therefore, this helps Chinese exports to be more competitive and explains the large Chinese current account surplus

    Government has used supply-side policies to increase productivity. E.g. education and training.
    However, there is a limit to what the government can do to increase productivity. Increased productivity can be due to other factors.

    Competitiveness in the Euro

    In the Euro, countries have a permanently fixed exchange rate - they cannot devalue to restore competitiveness. Therefore divergences in labour costs and productivity will have a bigger impact on competitiveness than in a floating exchange rate.
    .
    eu - competitiveness
    Source: Krugman, How overvalued is southern Europe? link
    This shows inflation in Spain is higher than Euro area - leading to a decline in Spanish competitiveness.
    See: EU Competitiveness

    4. Tax Rates

    Tax rates on labour and corporations will be a factor in determining competitiveness. For example, higher labour taxes will increase the unit cost of labour faced by firms, leading to lower competitiveness.

    5. Cost of Doing Business

    It is argued that countries with more labour market regulations, and regulations about doing business will have higher costs and lower competitiveness. For example, the difficulty in gaining planning regulations to expand a factory.

    The World Bank produces a list of countries which are the 'easiest places to do business'. The criteria include factors such as flexibility of labour markets, degree of regulations, protection of private property.

     Top 10 ease of doing business

    1. Singapore
    2.  Hong Kong
    3.  New Zealand
    4. United States
    5.  Denmark
    6.  Norway
    7.  United Kingdom
    8.  South Korea
    9.  Iceland
    10.  Ireland

    6. Infrastructure

    A key factor in determining competitiveness is the cost of transport. For example, some argue the UK's competitiveness is undermined by bottlenecks in transport, such as limited airport capacity in London and traffic jams on major roads.

    7. Tariffs and non-tariff barriers

    A key factor is the cost of tariffs and non-tariff barriers. For example, after the UK leaves the Single market, if it has regulatory divergence, then British business may have higher costs as a result of differing standards.

    Related

    Tuesday, October 2, 2012

    Does a Current Account Deficit Matter?

    A current account deficit measures the balance of trade in:
    • Goods
    • Services
    • Net investment incomes and transfers
    A deficit on the current account means a country is importing more than we are exporting. This will have to be matched by a surplus on the financial and / or capital account.

    The financial account comprises of two main features:
    • Short Term Capital flows e.g. hot money flows and purchase of securities
    • Long Term Capital flows e.g. investment in building new factories
    A deficit on the current account will be matched by a surplus on the financial/capital account


    Some economists argue we need not worry about a current account deficit. This is because:
    1. If a current account deficit is financed from long term capital inflows then this can be beneficial for the economy. Inward investment can increase the productive capacity of the economy.
    2. In an era of globalisation it is much easier to attract sufficient capital flows to finance the deficit.
    3. If the deficit gets too large it will cause a devaluation which helps to reduce the deficit. Also when there is a slowdown in consumer spending the deficit will fall.
    4. A current account deficit provides an outlet for domestic demand and prevents inflation.

    Reasons to Worry about a Current Account Deficit

    1. There could be problems financing the deficit in the long term. A short term deficit is not a problem, but if you have a deficit of over 6% of GDP, then it is a problem if you rely on Capital flows. A significant part of the current account deficit in US is financed by Chinese investors buying US securities, at relatively low interest rates.
    2. Most countries would not be able to borrow such large amounts at low interest rates. The US currently can because the US is seen as the World’s reserve currency. However if attitudes to the US economy change and investors lose their confidence in the US economy, they will stop buying US debt. This will cause two problems.
    • US interest rates will need to rise to attract enough people to buy the debt. These higher interest rates will reduce demand in the economy. Higher interest rates will particularly hurt American consumers who have large amounts of debt at the moment.
    • If capital flows can’t be attracted, then the dollar will continue to devalue further. This could cause inflationary pressures, interest rates may need to rise to stabilise the dollar.
    Basically to correct the deficit would be a painful experience for the US economy and result in a slowdown or possibly recession

    3. In the US the current account deficit is to a large extent caused by excess spending in the economy. It is partly caused by government borrowing which increases Aggregate Demand in the economy and hence growing demand for imports. A large current account deficit is often a sign of an unbalanced economy. It could be a sign of structural weakness and an uncompetitive manufacturing sector. This is particularly a problem in the Eurozone where the exchange rates are permanently fixed.

    4. A deficit on the current account increases foreign liabilities. In the beginning, a current account deficit could be just a deficit on buying goods. However, over time, the deficit will be increased by the interest payments on the capital surplus. Foreigners invest in the US. On these investments, they receive interest payments or dividends. These dividends count as a debit on the current account. Therefore the longer the deficit goes on the higher the level of investment income debits will be accrued. This means that in the future the economy will need to attract capital flows just to pay off the investment income. As well as the deficit on goods and services.

    US current account deficit reached 6% of GDP in 2006. This reflected strong domestic demand and a decline in competitiveness. The credit crunch caused a reduction in US current account deficit.

    Example of Iceland's Current Account Deficit


    Iceland is an example of a country with a large current deficit which later imploded.
    In the years leading up to 2008, there was a sharp inflow of capital to Icelandic banks. This enabled Iceland to run a record current account deficit. Iceland was spending more than they were earning. When capital flows dried up, banks lost money and there was a rapid deterioration in the current account.

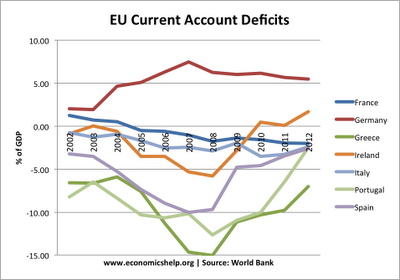
    Current Account Deficits in the Eurozone

    In the Eurozone, current account deficits are a bigger cause for concern because countries have a permanently fixed exchange rate (common currency). Therefore they can't devalue to restore competitiveness. Therefore countries may have to pursue internal devaluation (deflation) to restore competitiveness.

    Conclusion

    It depends on the size of the current account as a % of GDP. Clearly in Iceland's case, over 20% of GDP was unsustainable. But, in US case 6% of GDP later shrank to a more manageable 3% of GDP.
    A current account deficit is often a signal of another underlying problem. For example, a banking boom (in Iceland's case). A boom in domestic demand or a lack of competitiveness in Eurozone.

    See also:

    External links